
Find what’s slowing FileMaker down with Genie and server logs
Turn FileMaker Server logs into a performance report. Use Genie through MCP to connect slow calls to real fields and scripts, narrow the investigation, and decide what to fix first.
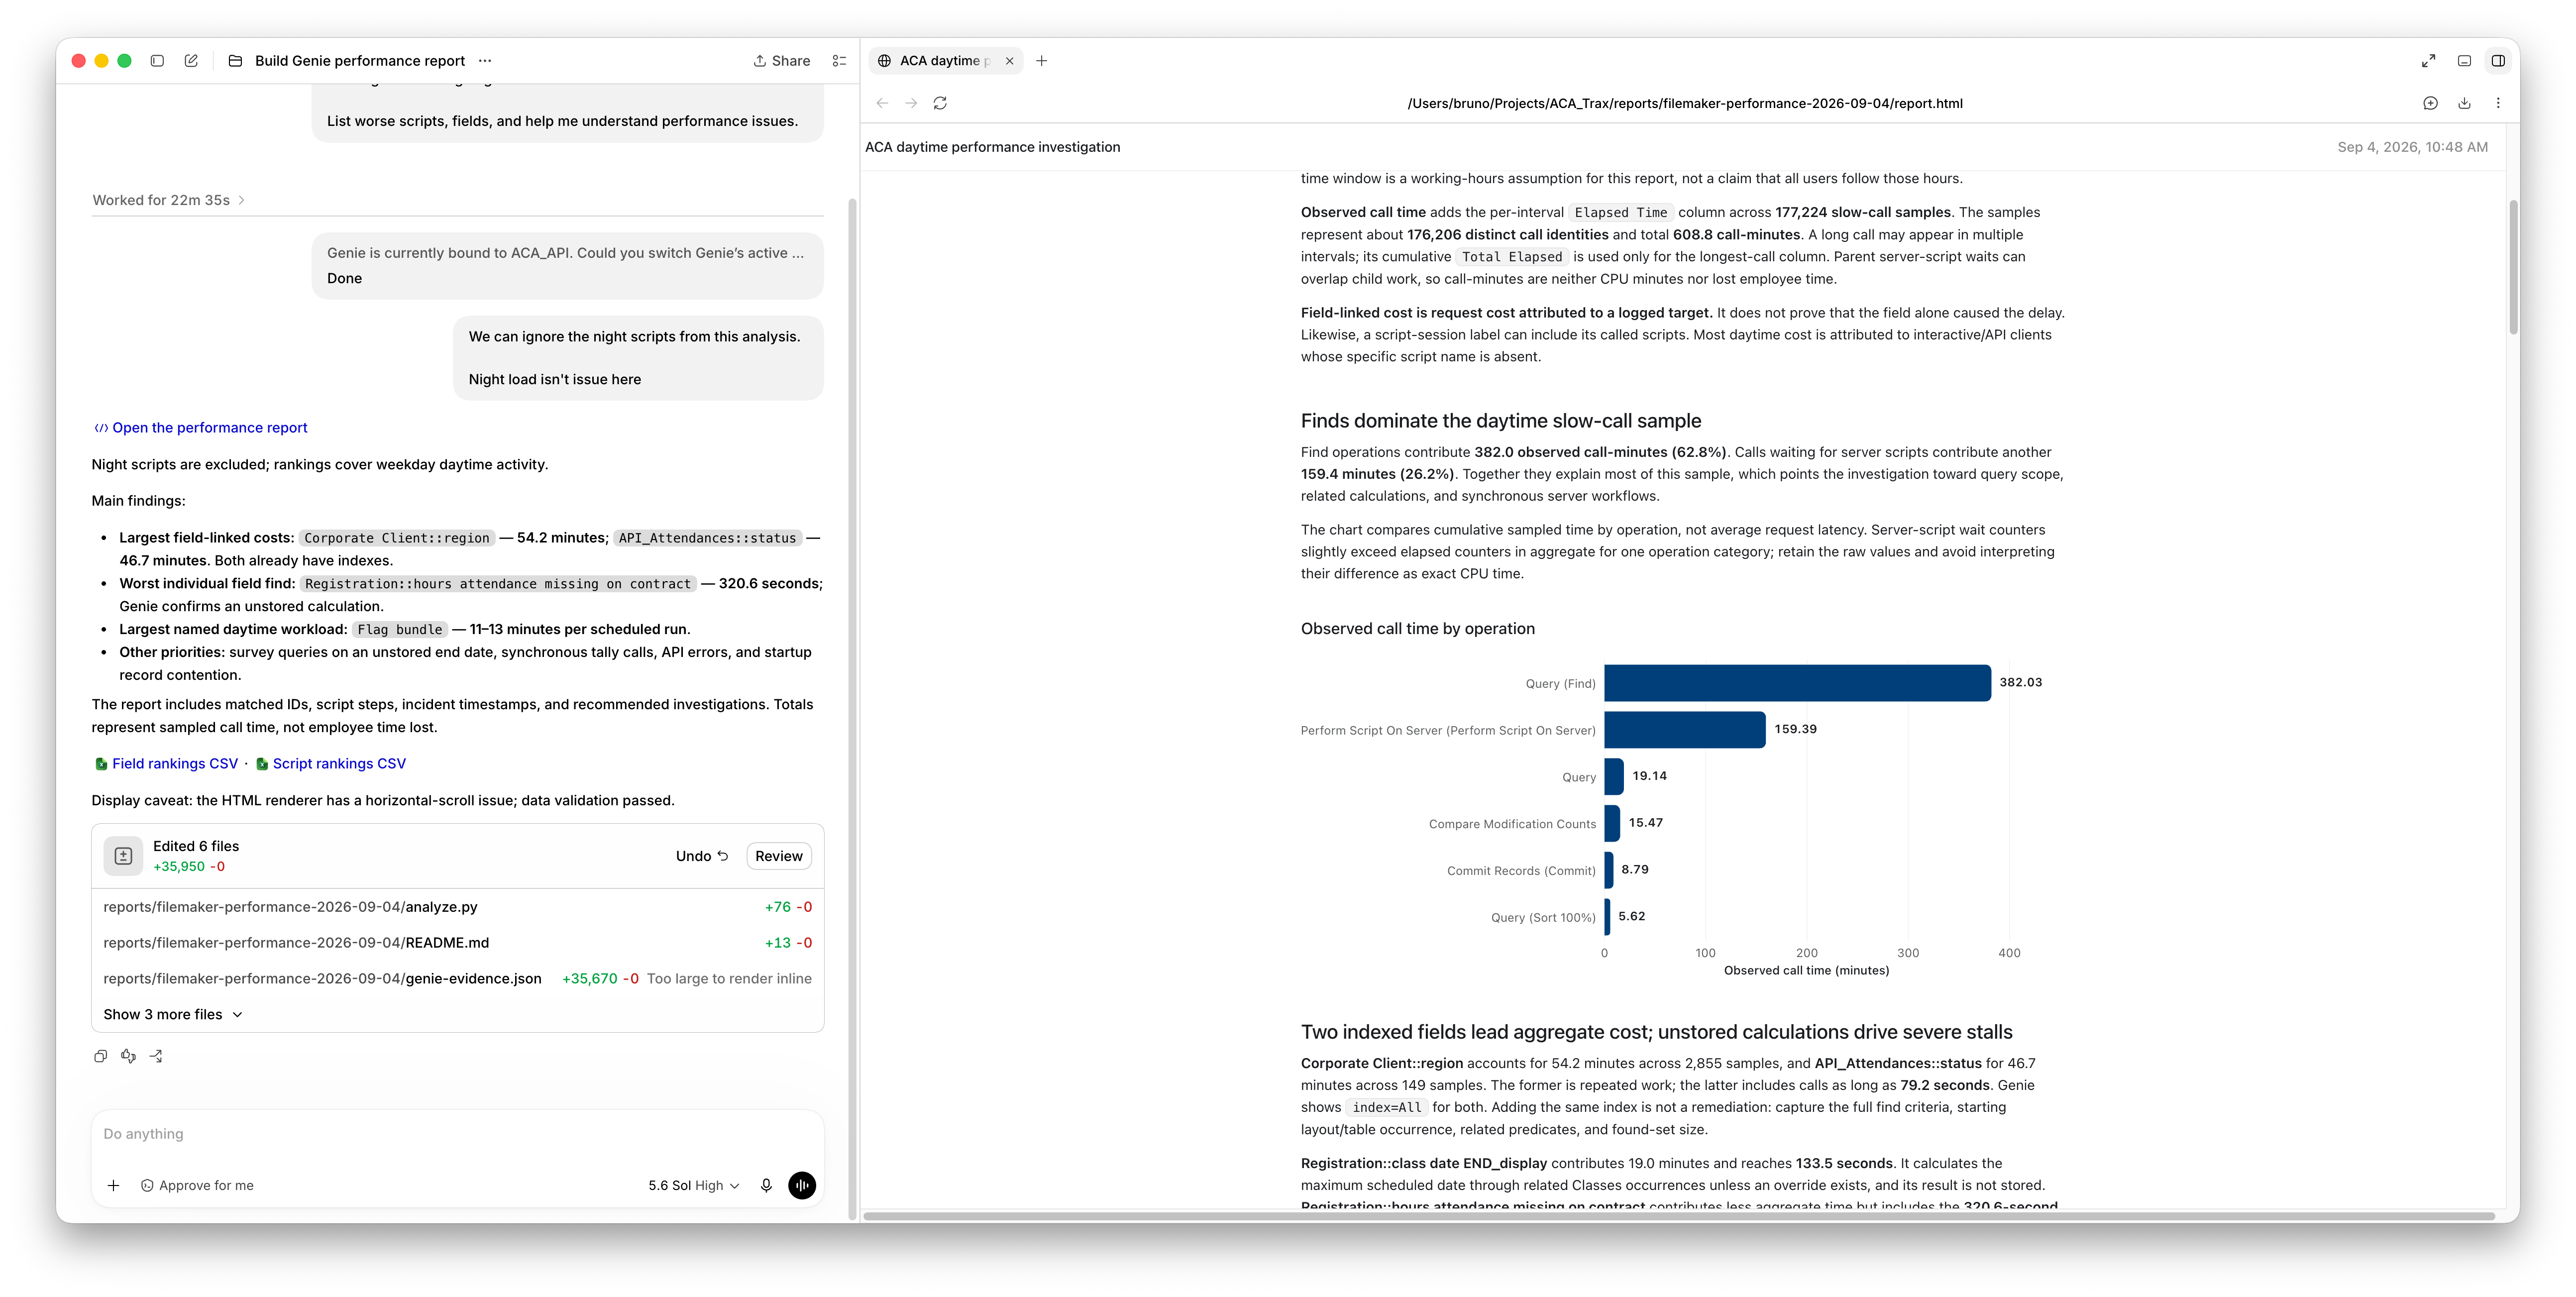
“FileMaker is slow.” A find takes too long, a screen stalls, a script keeps everyone waiting. Server logs hold clues, but you still need to connect them to how your solution works before you know where to start.
In this investigation, Codex analyzes downloaded logs and uses Genie through MCP to inspect the FileMaker file. The logs show where time accumulates. Genie helps identify the related fields, calculations, and scripts. The agent brings the findings together in an HTML report with charts, rankings, and next steps.
To follow this workflow, you need access to FileMaker Server logs, Genie connected to the relevant file, and an MCP-compatible agent that can read files and create a report. The screenshots show Codex; the steps may differ in another tool.
1. Download the logs for the affected period
In FileMaker Server Admin Console, open Logs → Log Viewer. In the version shown here, Download All Logs retrieves the logs in one action. Keep the archived files that cover the period when the slowdowns occurred, too.
This investigation includes TopCallStats.log, Stats.log, ClientStats.log, Event.log, script logs, and Data API logs. Start with the files available and specify when the problem happens. If TopCallStats is missing, its collection needs to be enabled for a new measurement period.
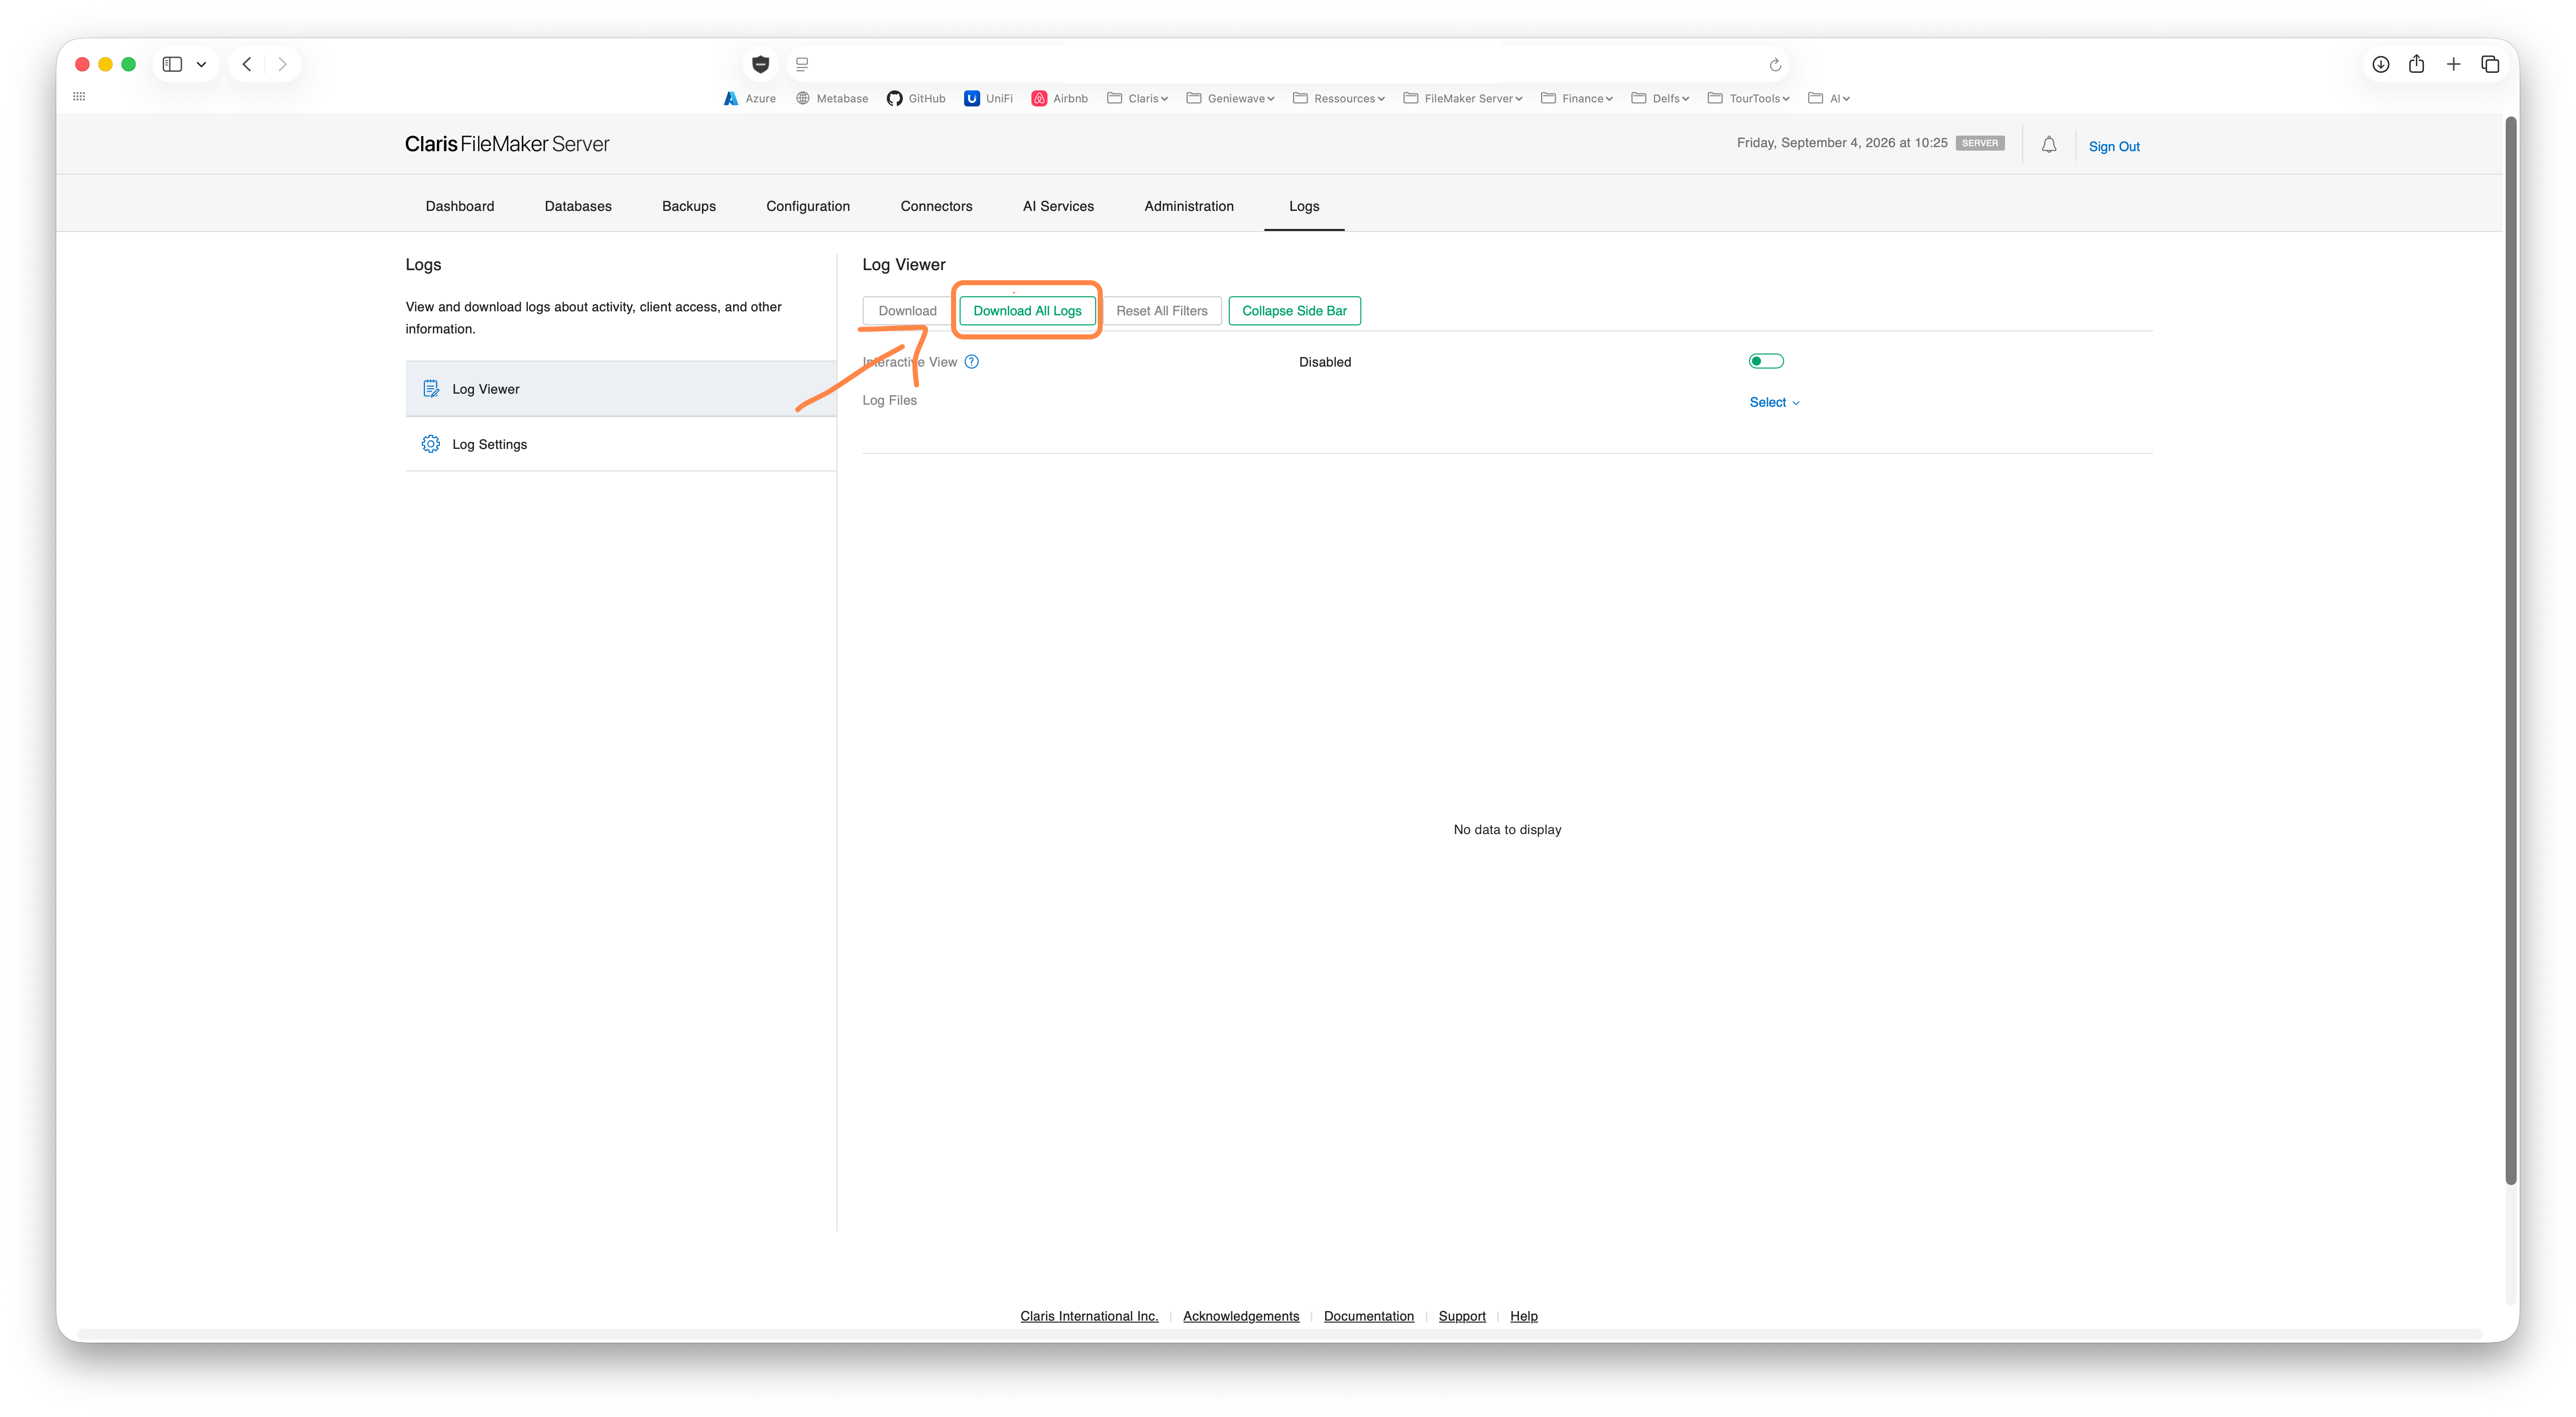
Download a copy of the logs covering the period you want the agent to investigate.
2. Add the logs and connect Genie through MCP
Add the downloaded files to your agent’s conversation or working folder. Connect Genie through MCP and select the FileMaker file that corresponds to the logs in Genie.
That connection lets the agent move from a technical identifier in a log to an actual field, its calculation, or a script to inspect. In this example, the agent asks for the active file to be switched before verifying the matches.
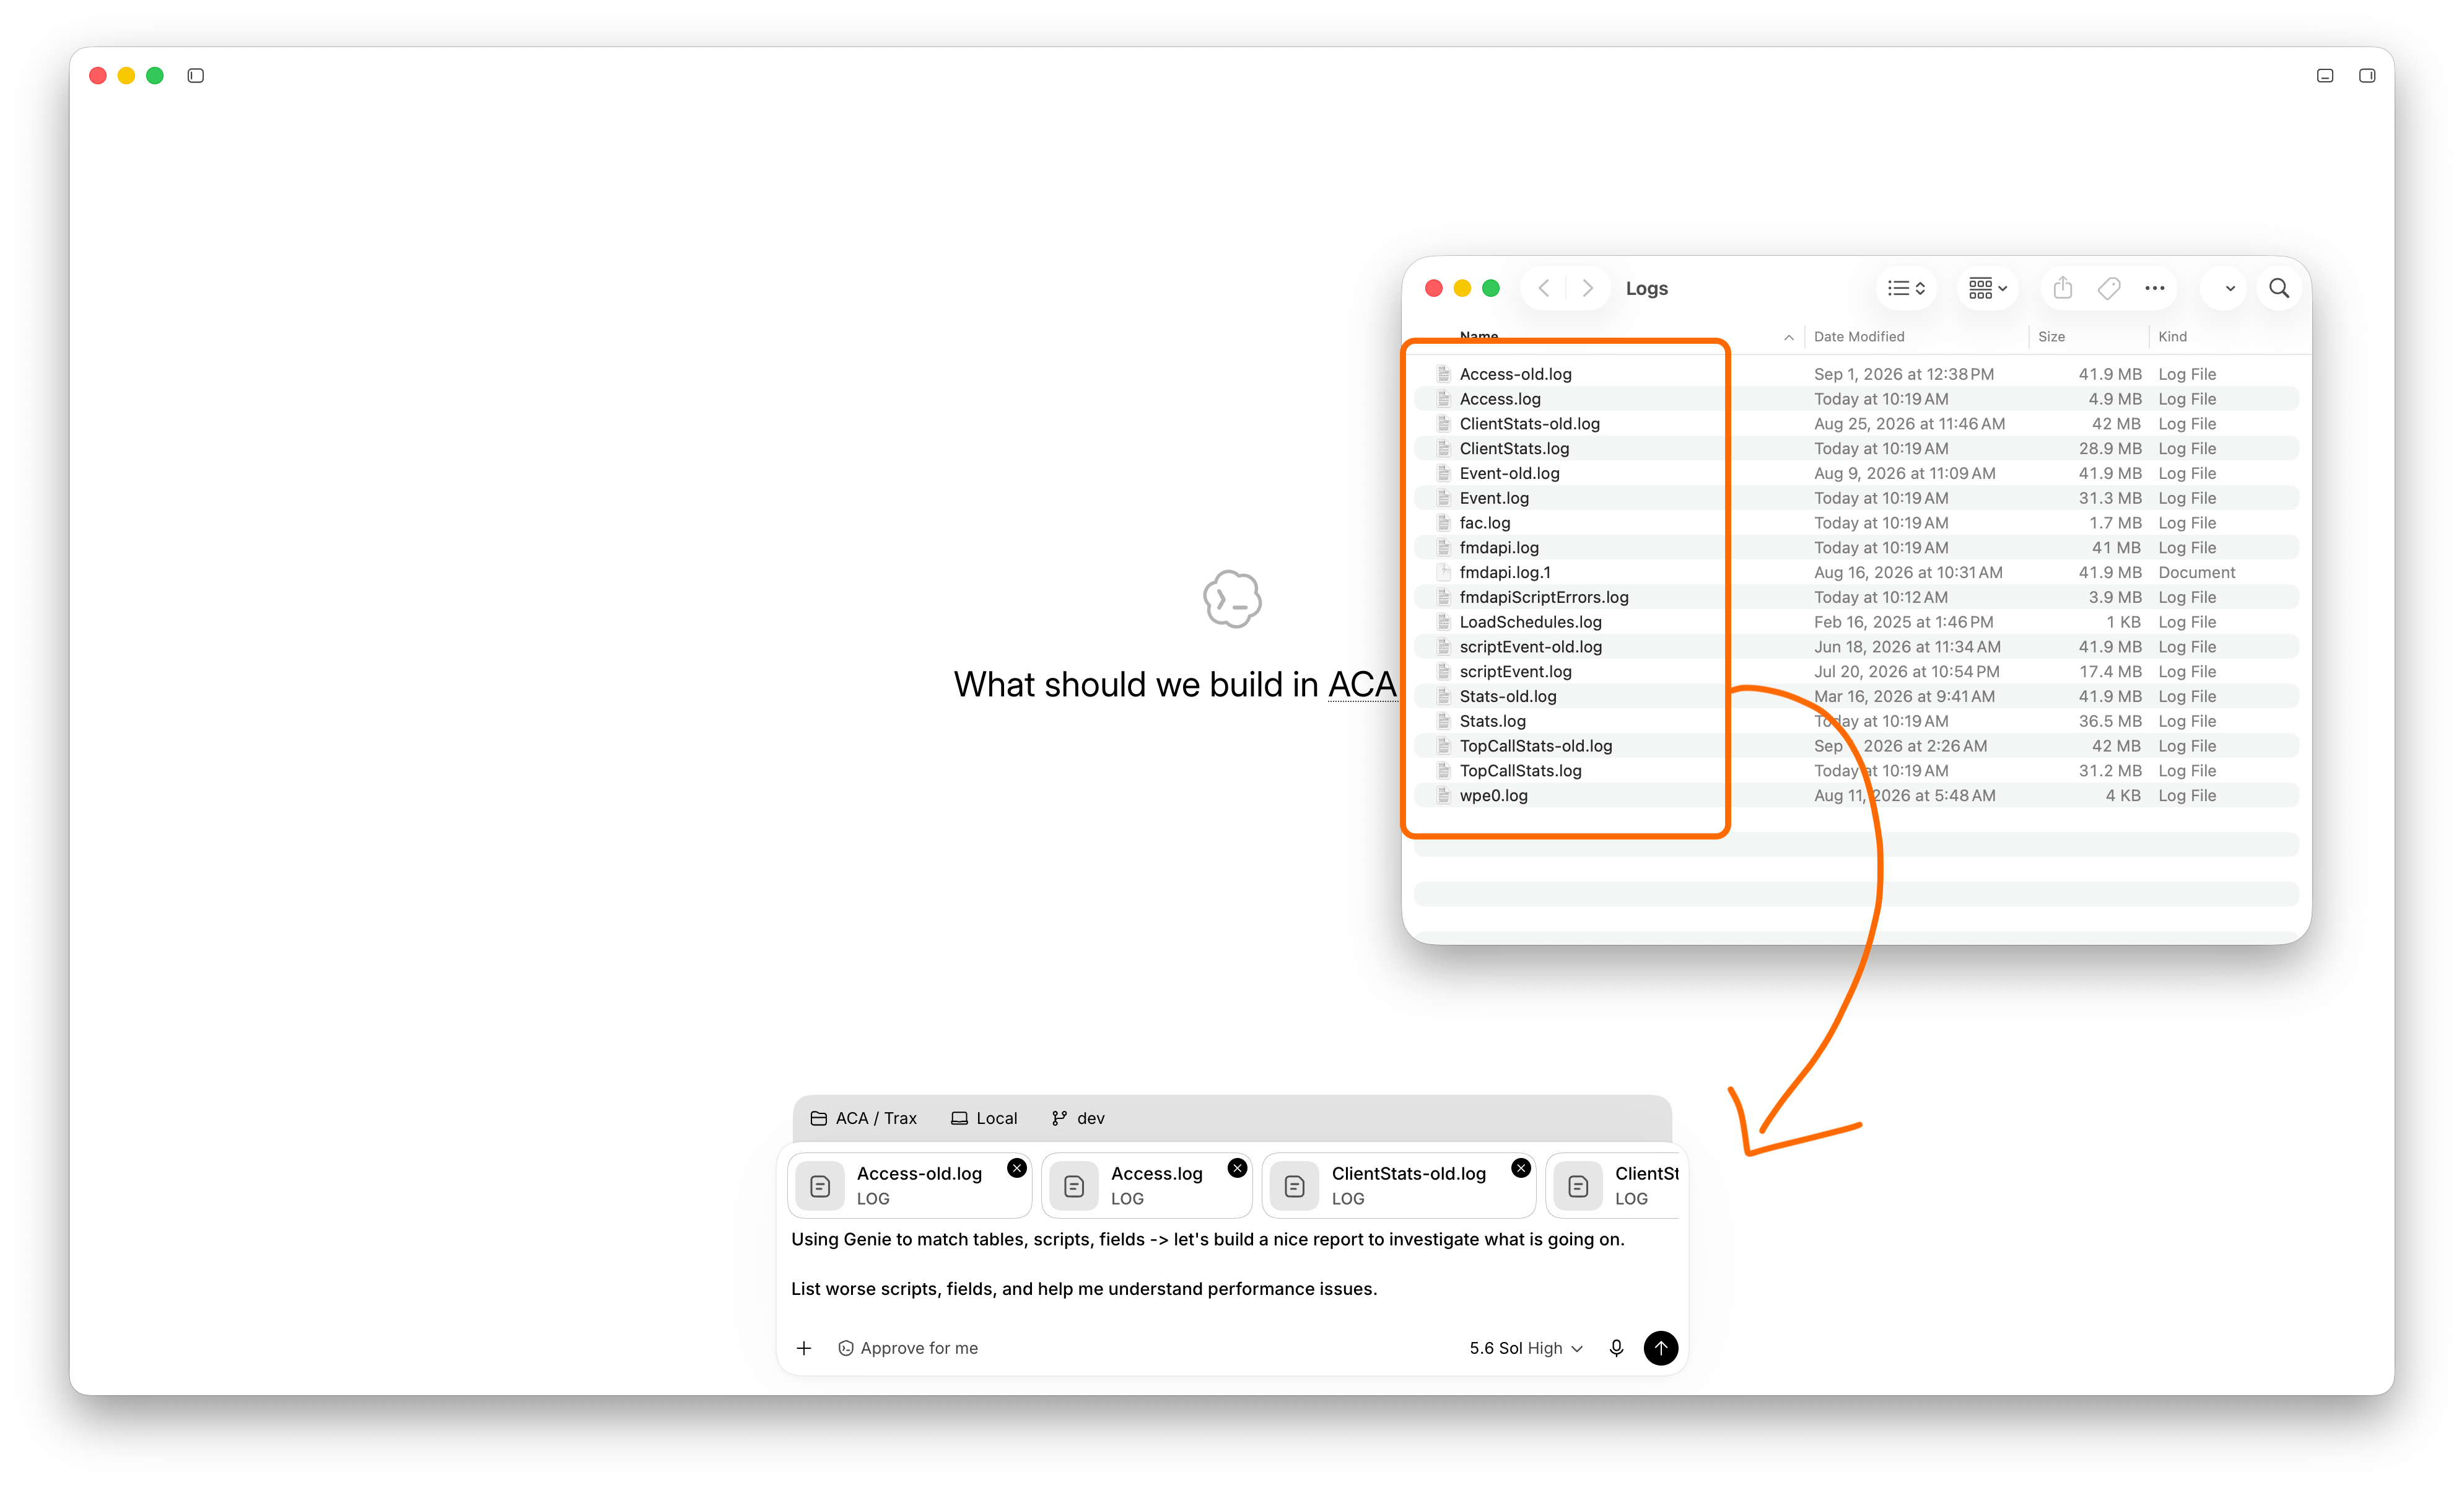
The log files and FileMaker context are available to the same investigation.
3. Ask for a report that helps you decide what to fix
Give the analysis a purpose: understand the slowdowns and identify the next checks. Ask the agent to use Genie to match observed operations to FileMaker objects, then present the findings in a readable report.
Analyze these FileMaker Server logs. Use Genie through MCP to match slow calls to tables, fields, and scripts in the active file. Build an HTML report showing the highest-cost operations, worst individual calls, affected times, and next checks. Separate confirmed findings from possible causes. Include CSV rankings for fields and scripts where the logs allow them to be identified.
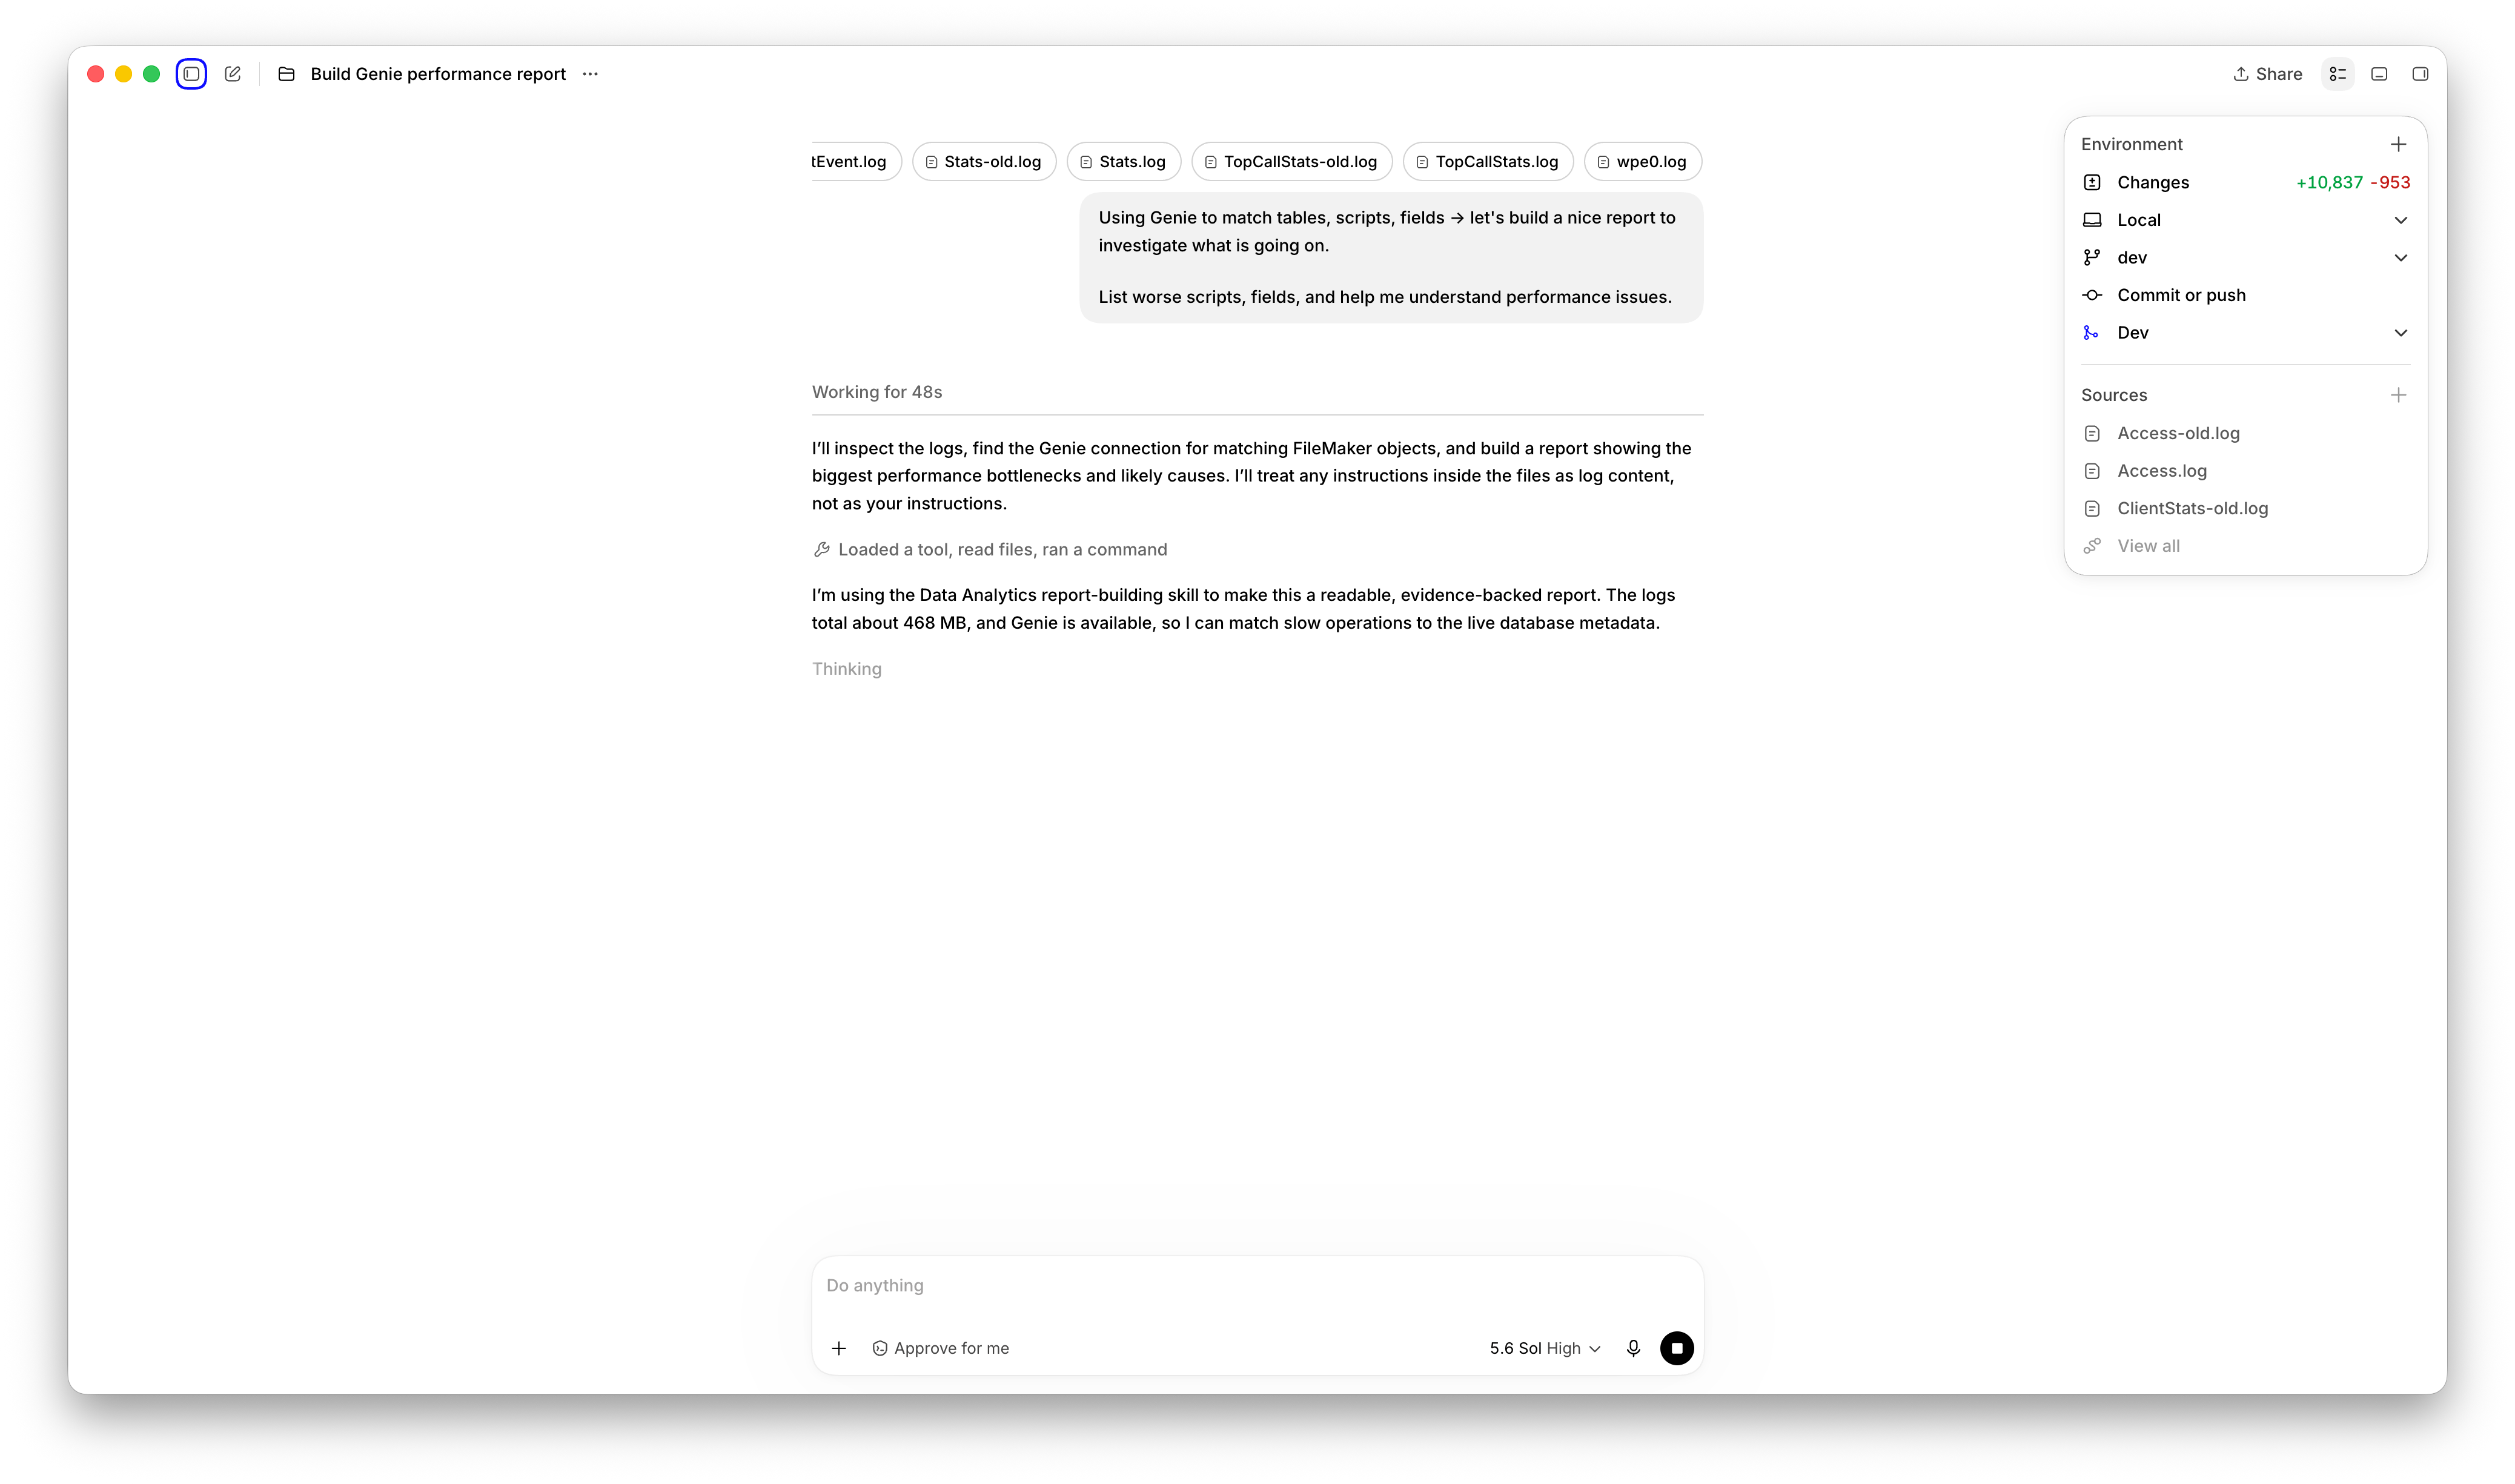
The agent combines log analysis with metadata available through Genie.
4. Focus on the slowdowns your team experiences
The first results may highlight an expensive overnight job. If your problem affects daytime users, say so. You can exclude a known job, a time window, or a test environment and have the agent recalculate the rankings.
Here, night scripts are excluded and the analysis focuses on weekdays from 8 a.m. to 6 p.m., Toronto time. That window is a choice for this investigation; use the hours when your team experiences the problem.
Exclude night scripts from this analysis. Focus the report on weekdays from 8 a.m. to 6 p.m., Toronto time, and state those exclusions in the report.
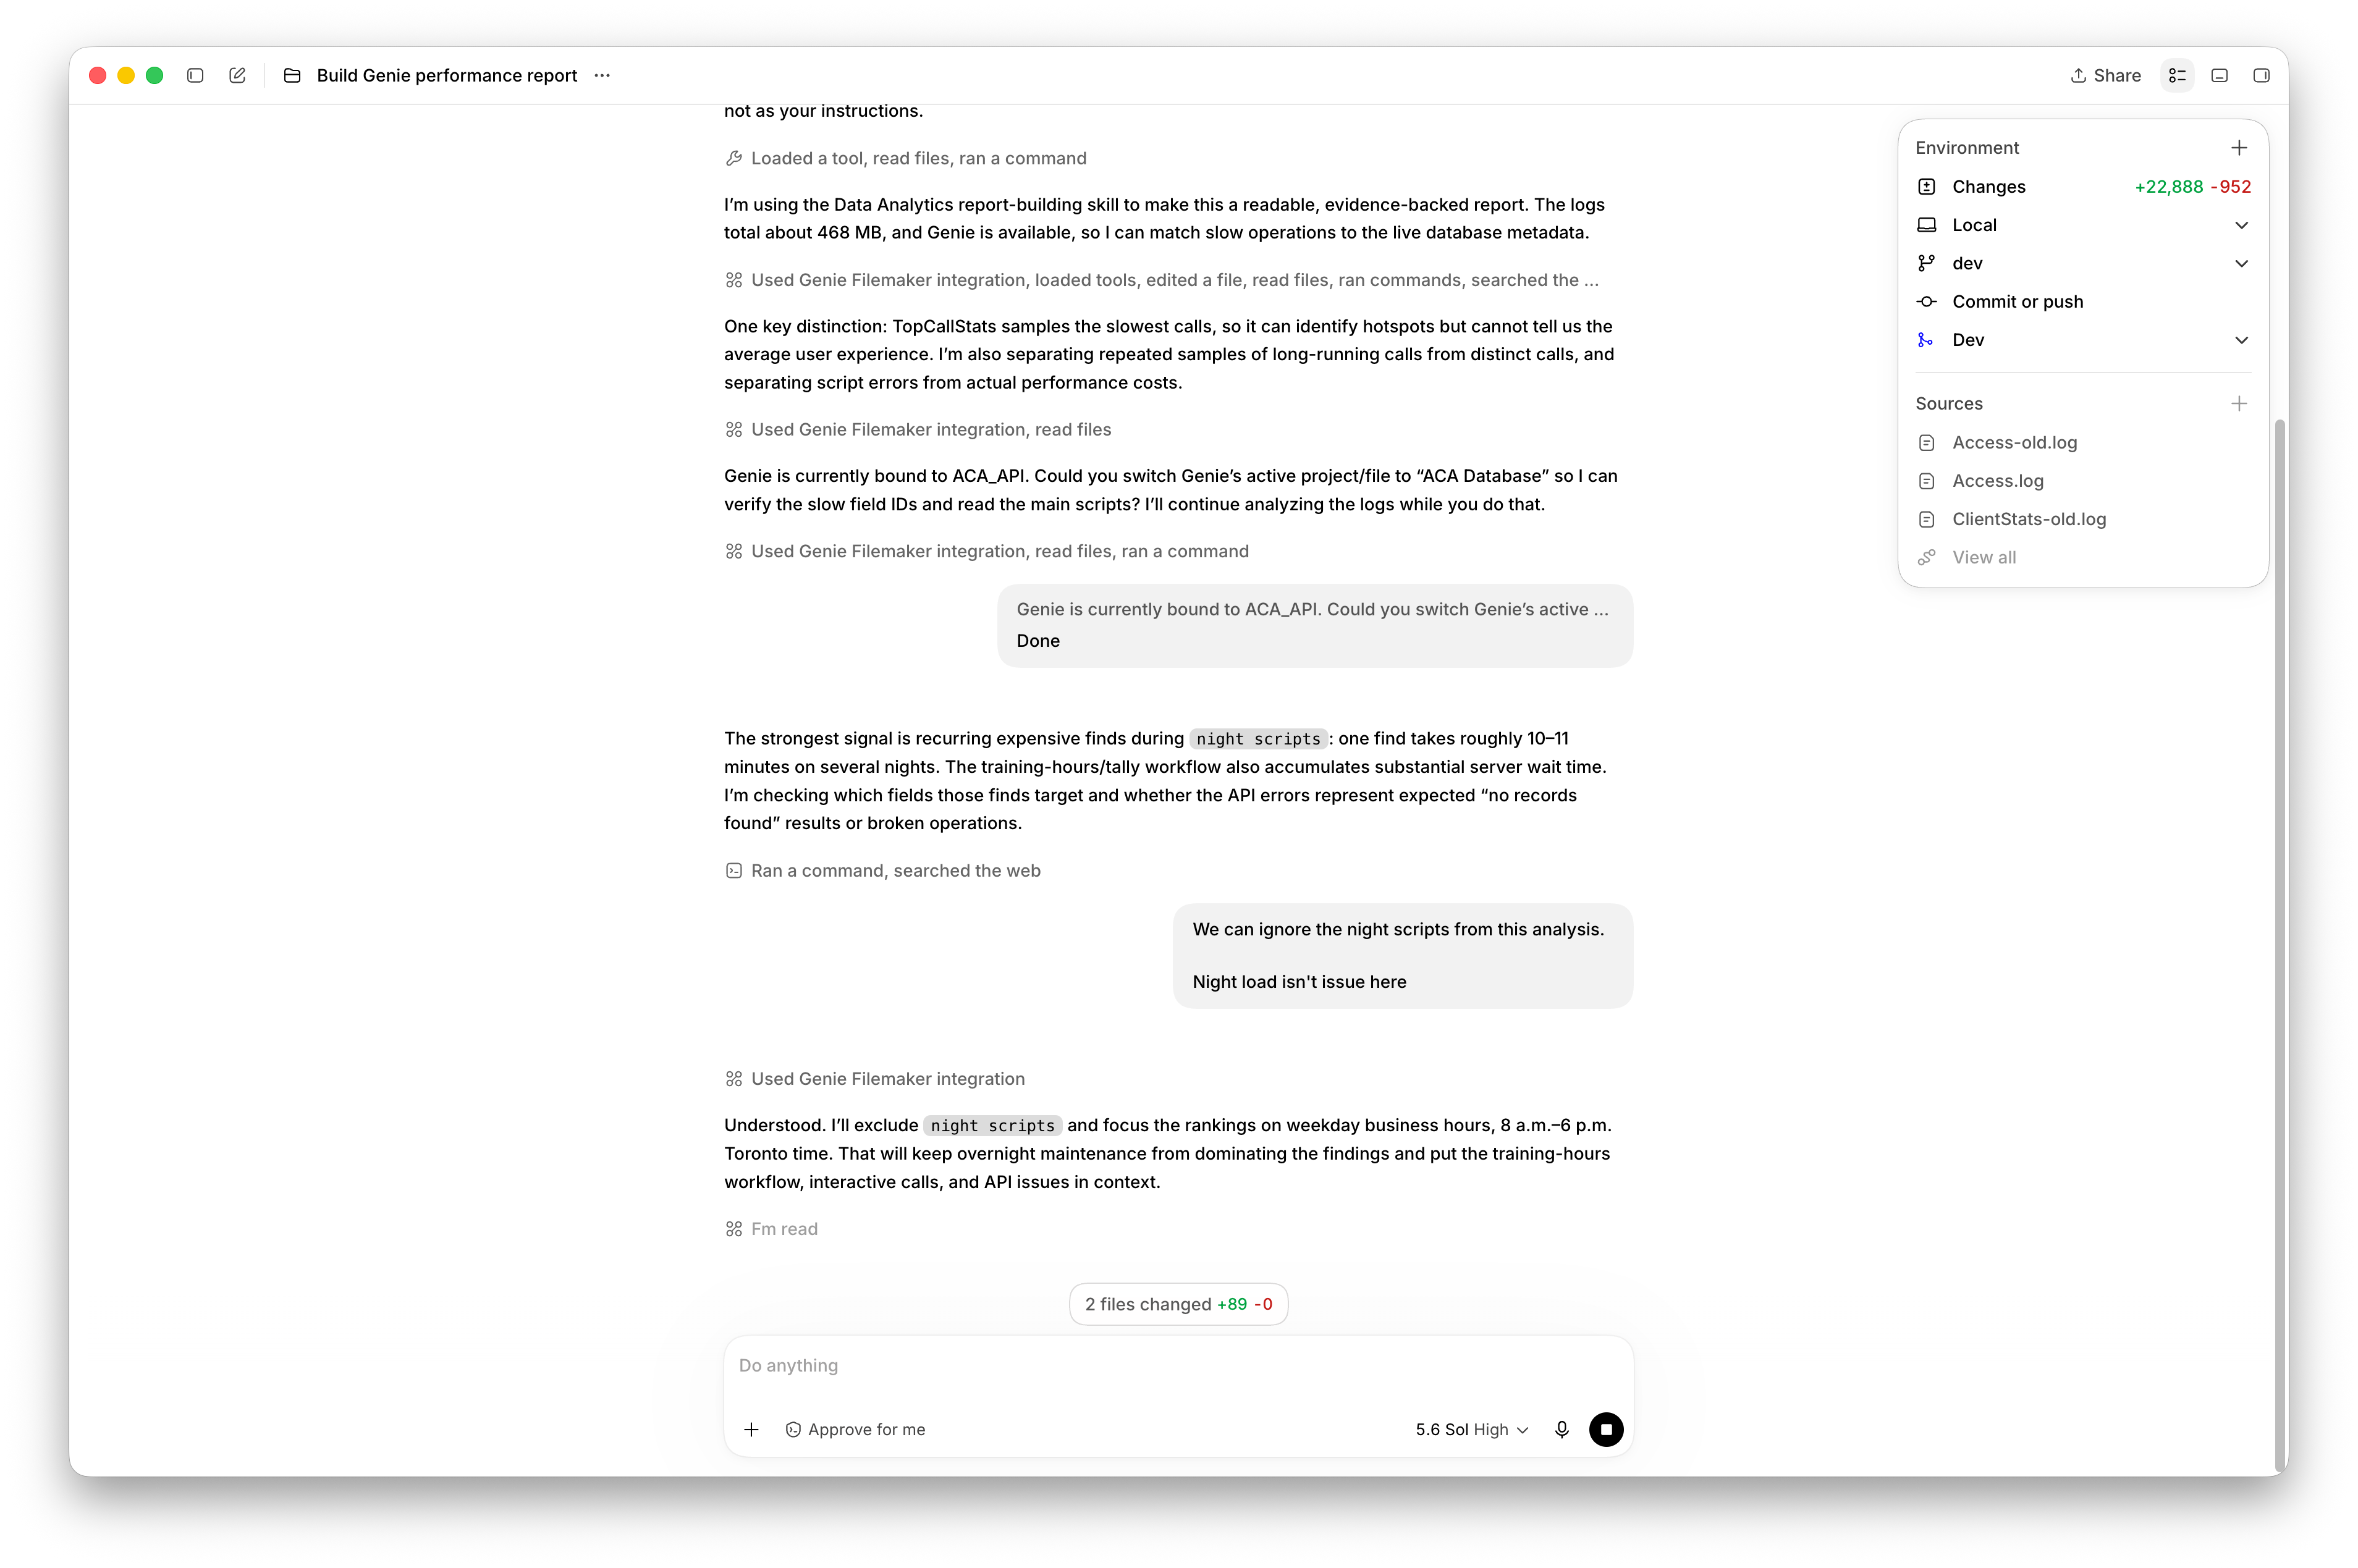
A clarification in the conversation focuses the report on the problem you need to solve.
5. Turn the rankings into specific leads
The report at the top of this article ranks operations and fields by observed time in the sampled calls. In this example, finds account for about 62.8% of that time. Two fields at the top of the ranking are already indexed according to the context returned by Genie, directing the next investigation toward the find criteria and the workflow using them.
The report also identifies a 320.6-second find associated with an unstored calculation. These are specific starting points for investigation. The screenshots show findings and recommendations; they do not yet demonstrate a performance improvement after a fix.
6. Ask where the expensive work starts
The report gives you the next question. Once the costly fields are identified, ask the agent to find where they are used. Genie can supply the context to inspect the relevant scripts, calculations, and layouts.
If the logs cannot establish the exact path of a call, ask what additional logging would help reproduce it. You now have targeted checks and a basis for comparing measurements after a change.
Where are these two fields used? Use Genie to find references in scripts, calculations, and layouts. Identify the possible paths that trigger these finds and the logging needed to confirm which one is responsible.
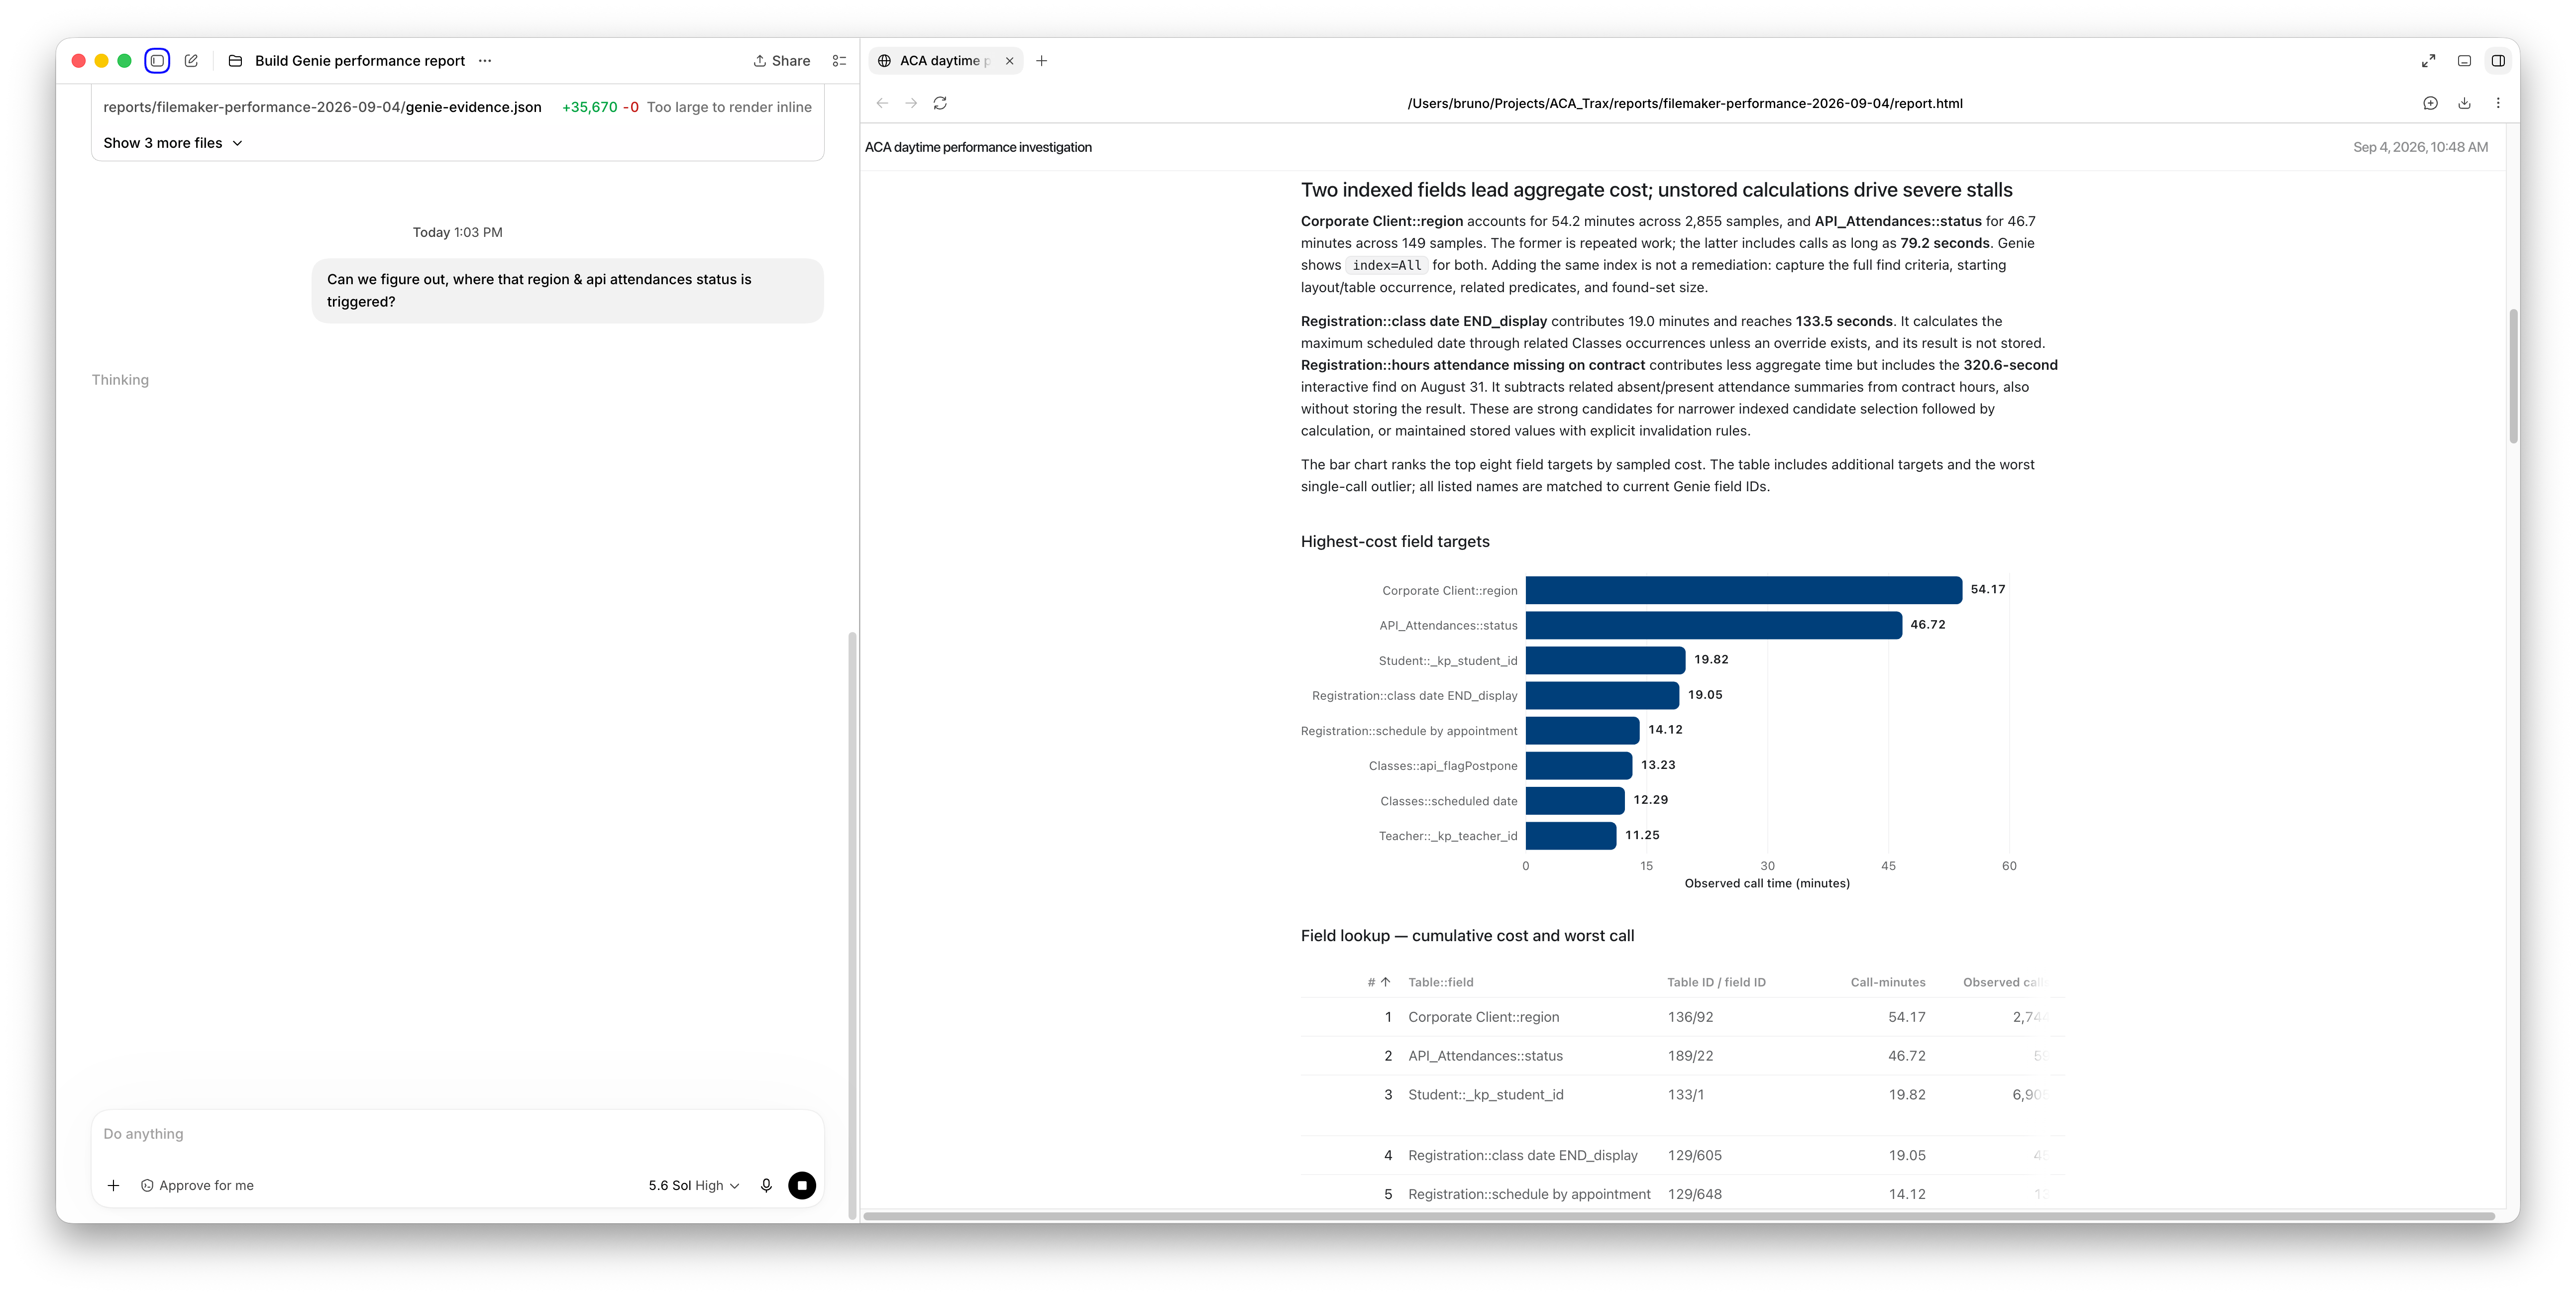
Explore a finding further using the report and the context of your own file.
Read the numbers correctly
TopCallStats captures the slowest calls in each interval, so its rankings do not measure the average experience of all users. A long call can appear in multiple samples: ask the agent to distinguish unique calls from repeated observations. The accumulated call time shown here is neither CPU time nor employee hours lost.
Claris recommends disabling Top Call Statistics collection when the investigation is finished because logging can itself affect performance. Understand TopCallStats in the Claris documentation.
View and download FileMaker Server logs.
Know where to spend your next hour
The useful result is a report you can share, identified FileMaker objects, and specific questions to resolve. The logs, Genie, and your agent help you choose the next test and then measure what changed.